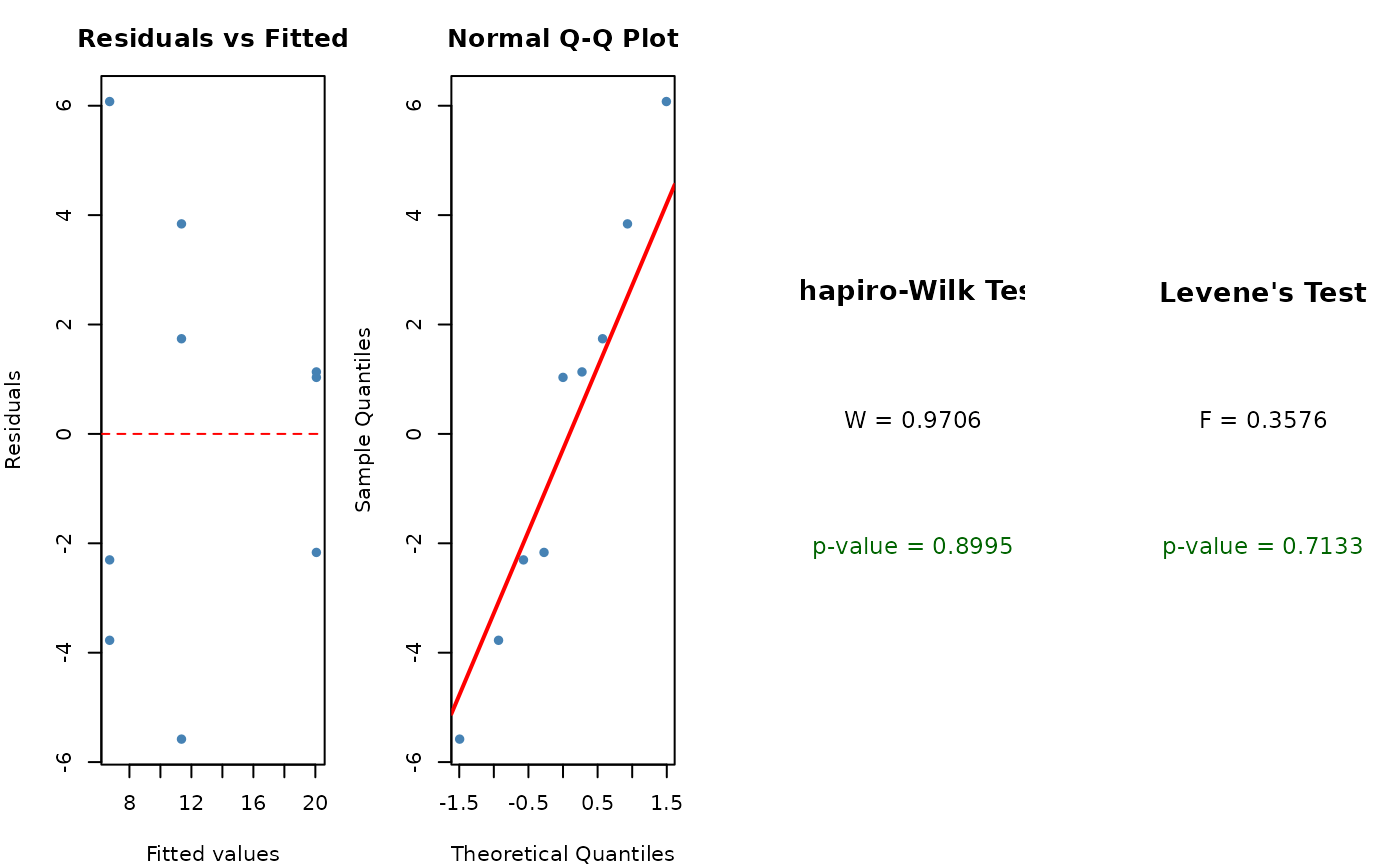
Produces a 2x2 panel of diagnostic plots for an ANOVA or linear model: residuals vs fitted, Q-Q plot, Shapiro-Wilk test result, and Levene's test result (if a grouping variable is provided).
Produces a 2x2 panel of diagnostic plots for an ANOVA or linear model: residuals vs fitted, Q-Q plot, Shapiro-Wilk test result, and Levene's test result (if a grouping variable is provided).